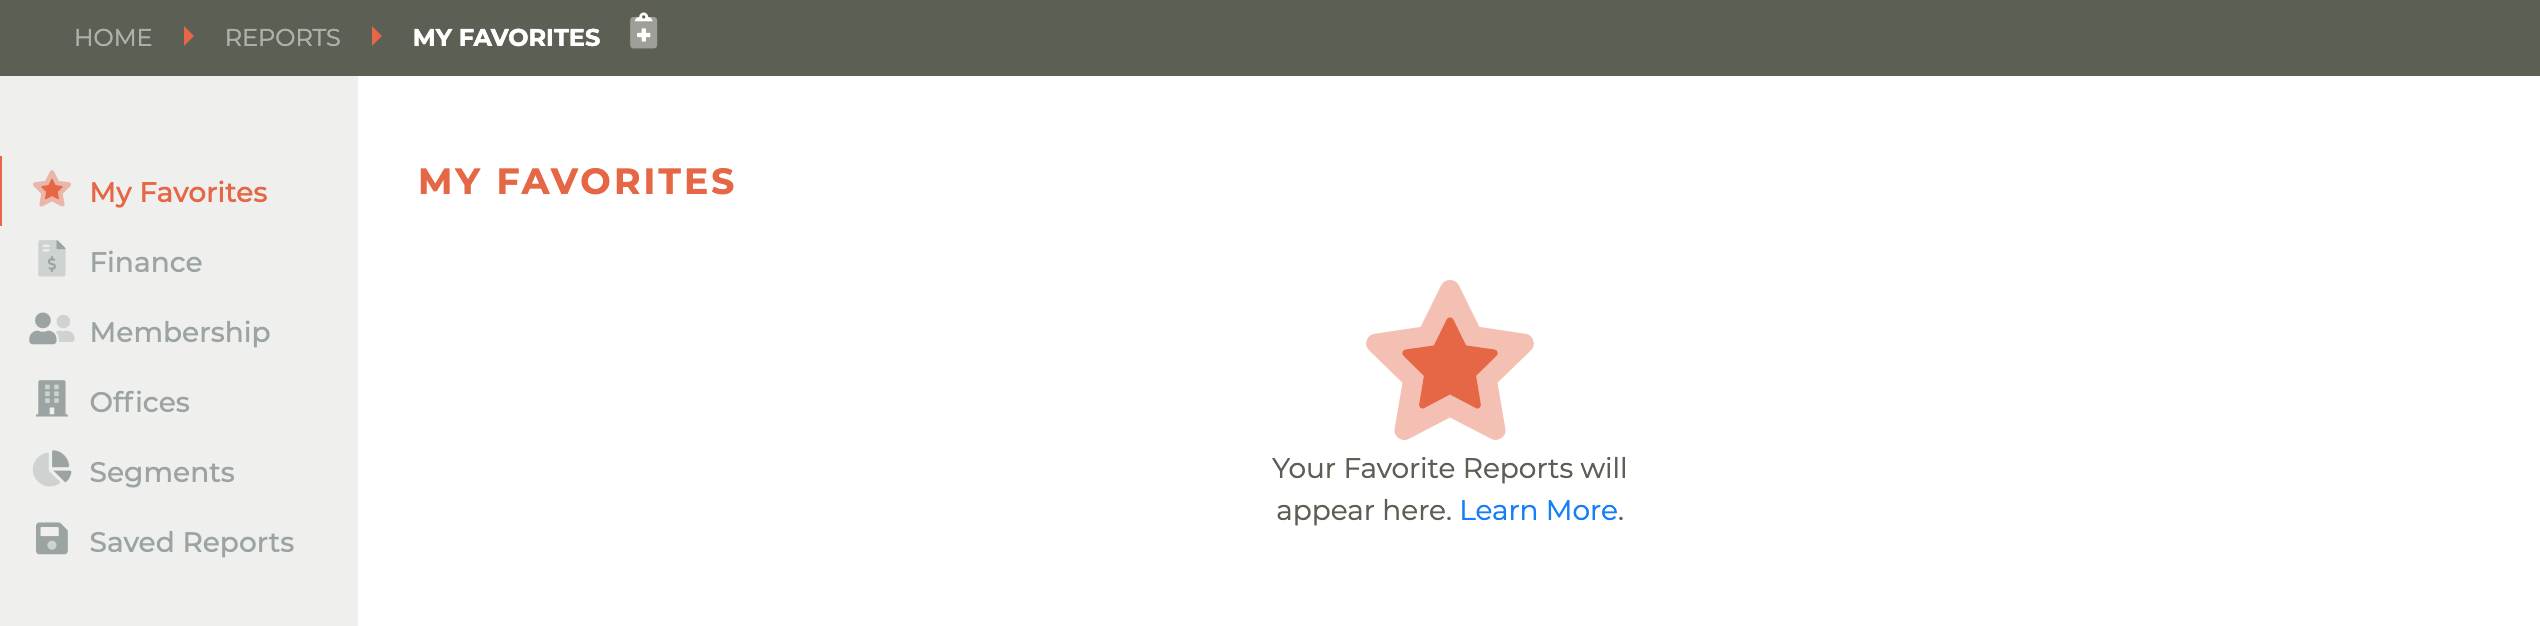
¶ My Favorites
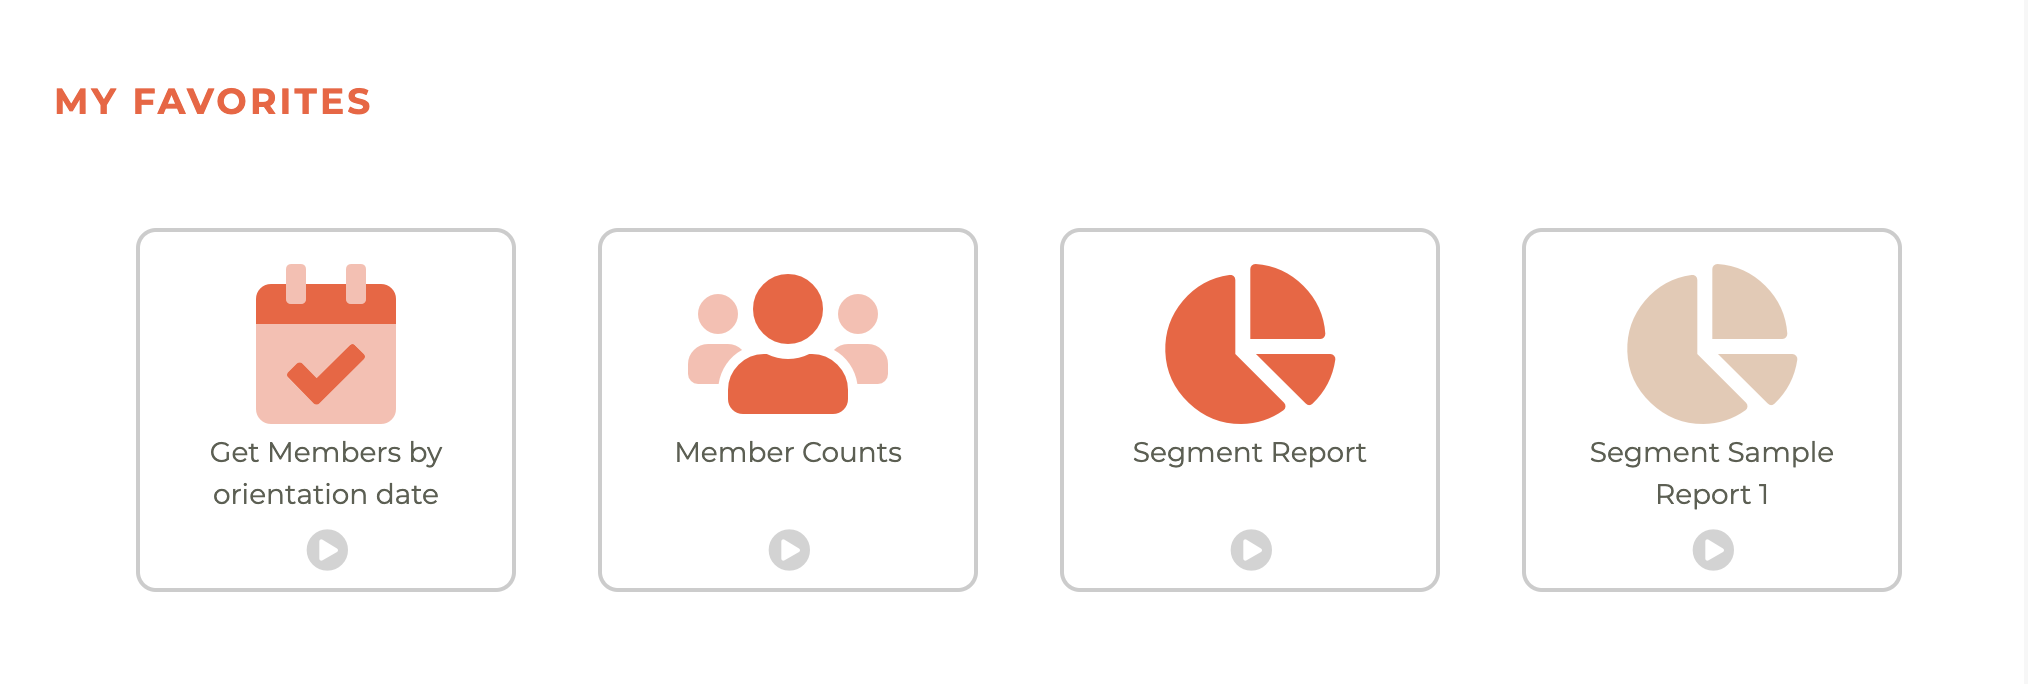
The top dashboard for the Reports module in Tangilla is the "My Favorites" dashboard. This is exactly what the name implies, a place to view your personal favorite reports.
These can be your favorite report generators, which can also be found in any Report Category, or specific reports you've built. They can be global reports or reports you've saved for your use only. Report generators appear in orange, as you see below.
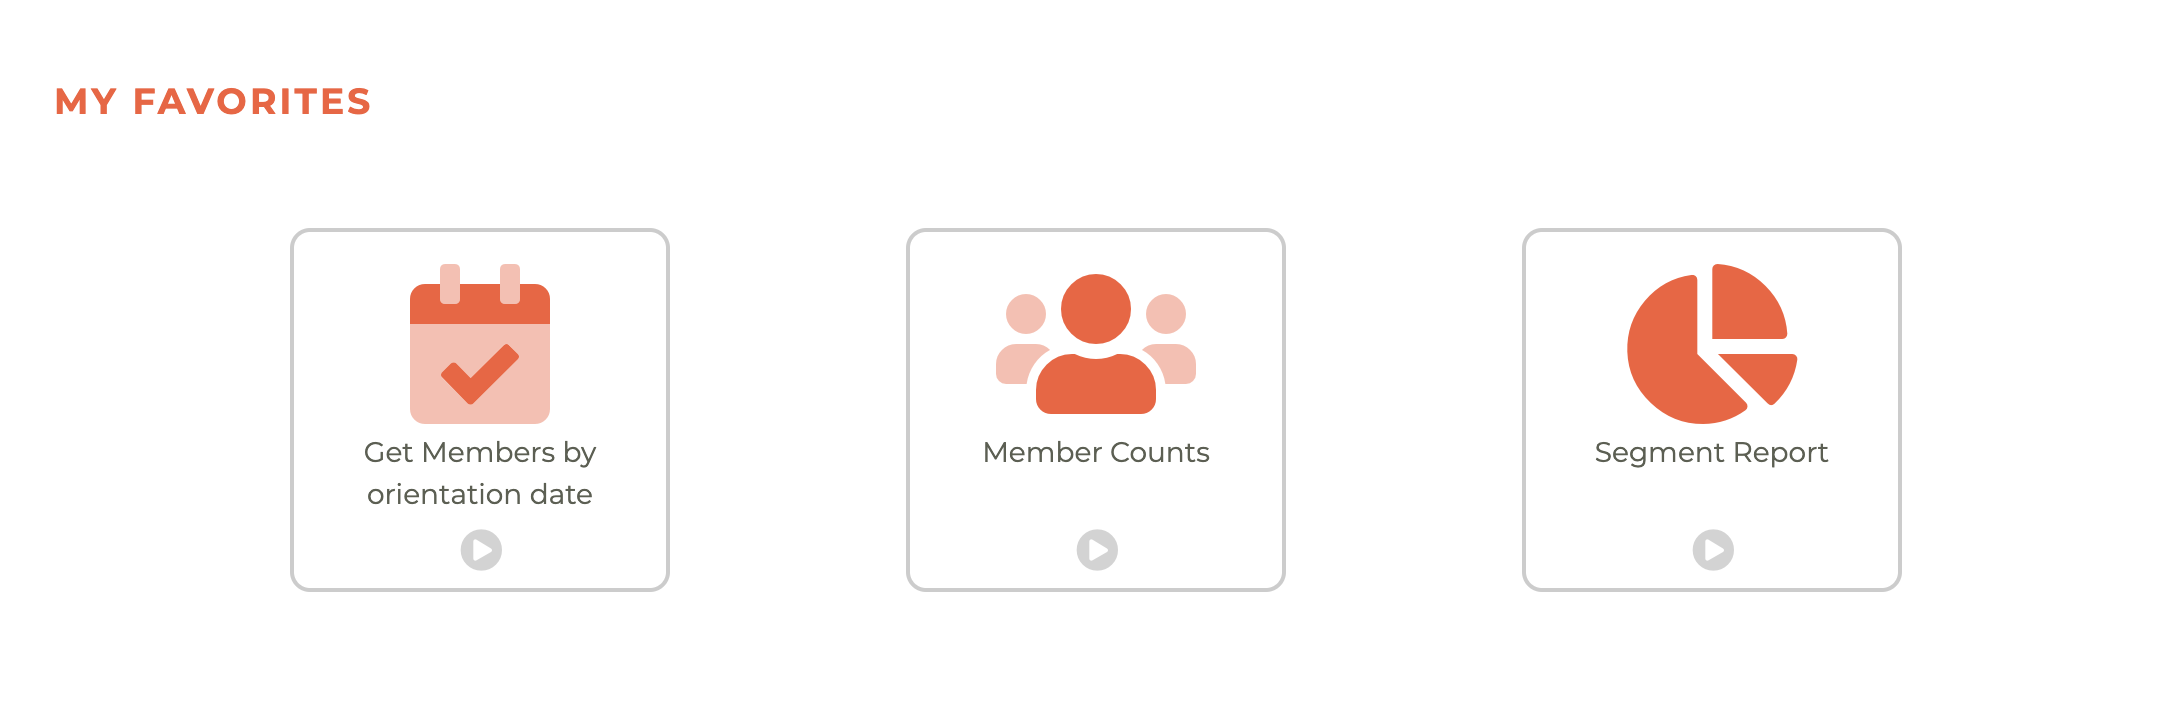
When you add specific reports you've created or global reports others may have created, those reports appear in light brown, as the Sample Segment Report 1 does below.
¶ Adding Reports To My Favorites
To add any report to your favorites, simply click on the favorite box for the report you wish to appear in your favorites.
¶ Favoriting A Report
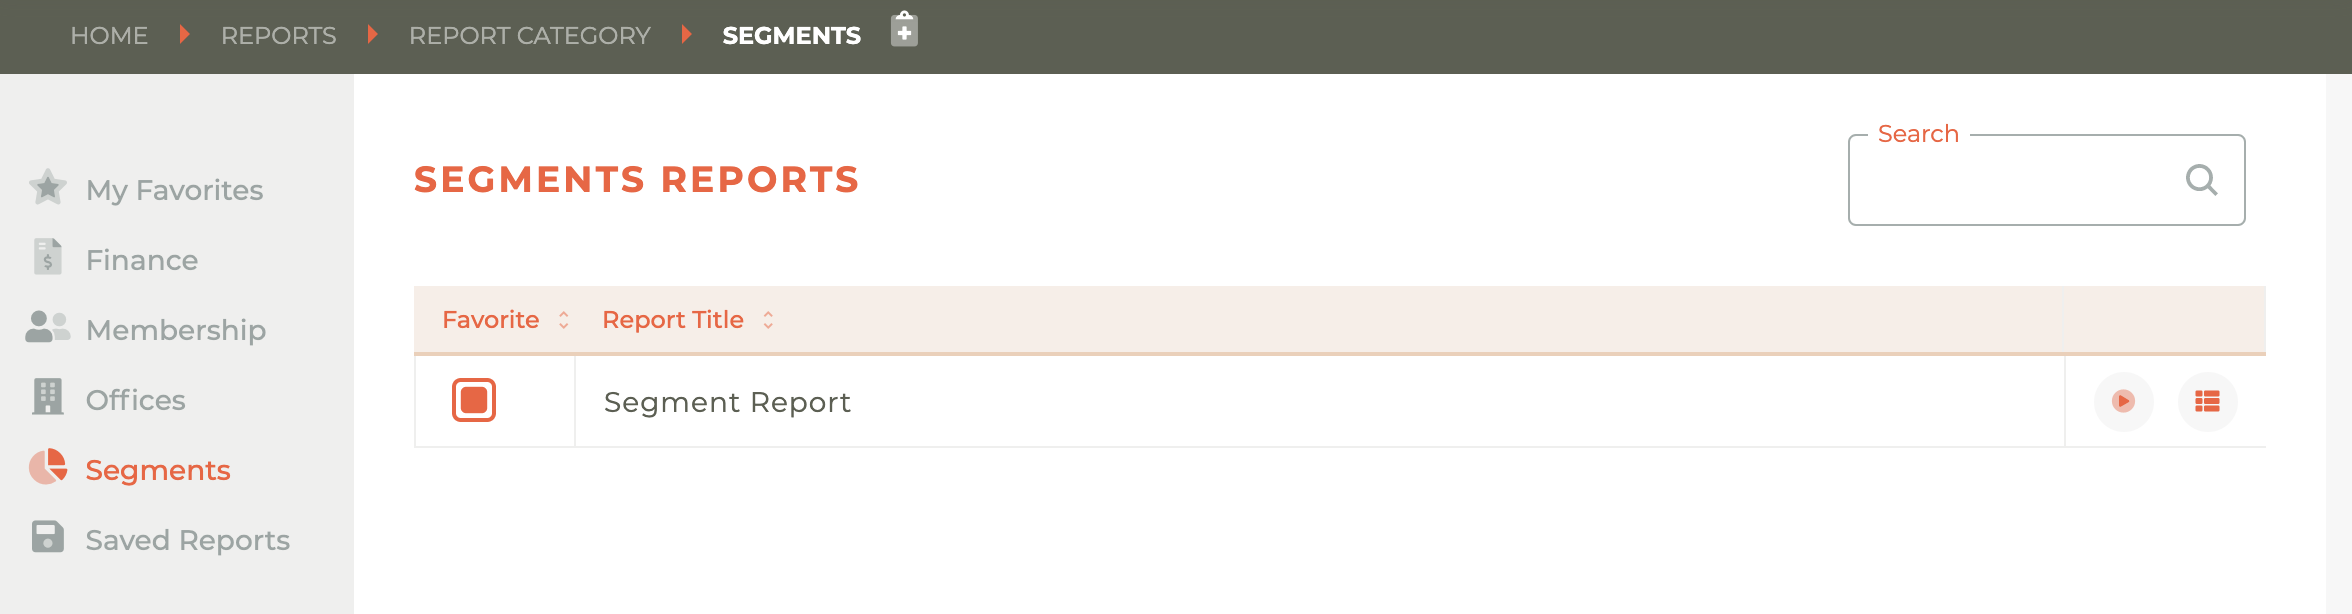
To favorite a Report, click on the favorite box for the Report you wish to favorite at the top level of any Report Category. The different Report Categories are listed in the left hand menu.
¶ Saving & Favoriting A Segment Report
Any Report can be saved and favorited, but some Reports are best saved and/or favorited after they have been defined. Then once they are saved, they retain your specific selections. A Segment Report is an example of a Report that is best saved after you've defined the fields and the parameters for the report. These can be global or viewable only by you.
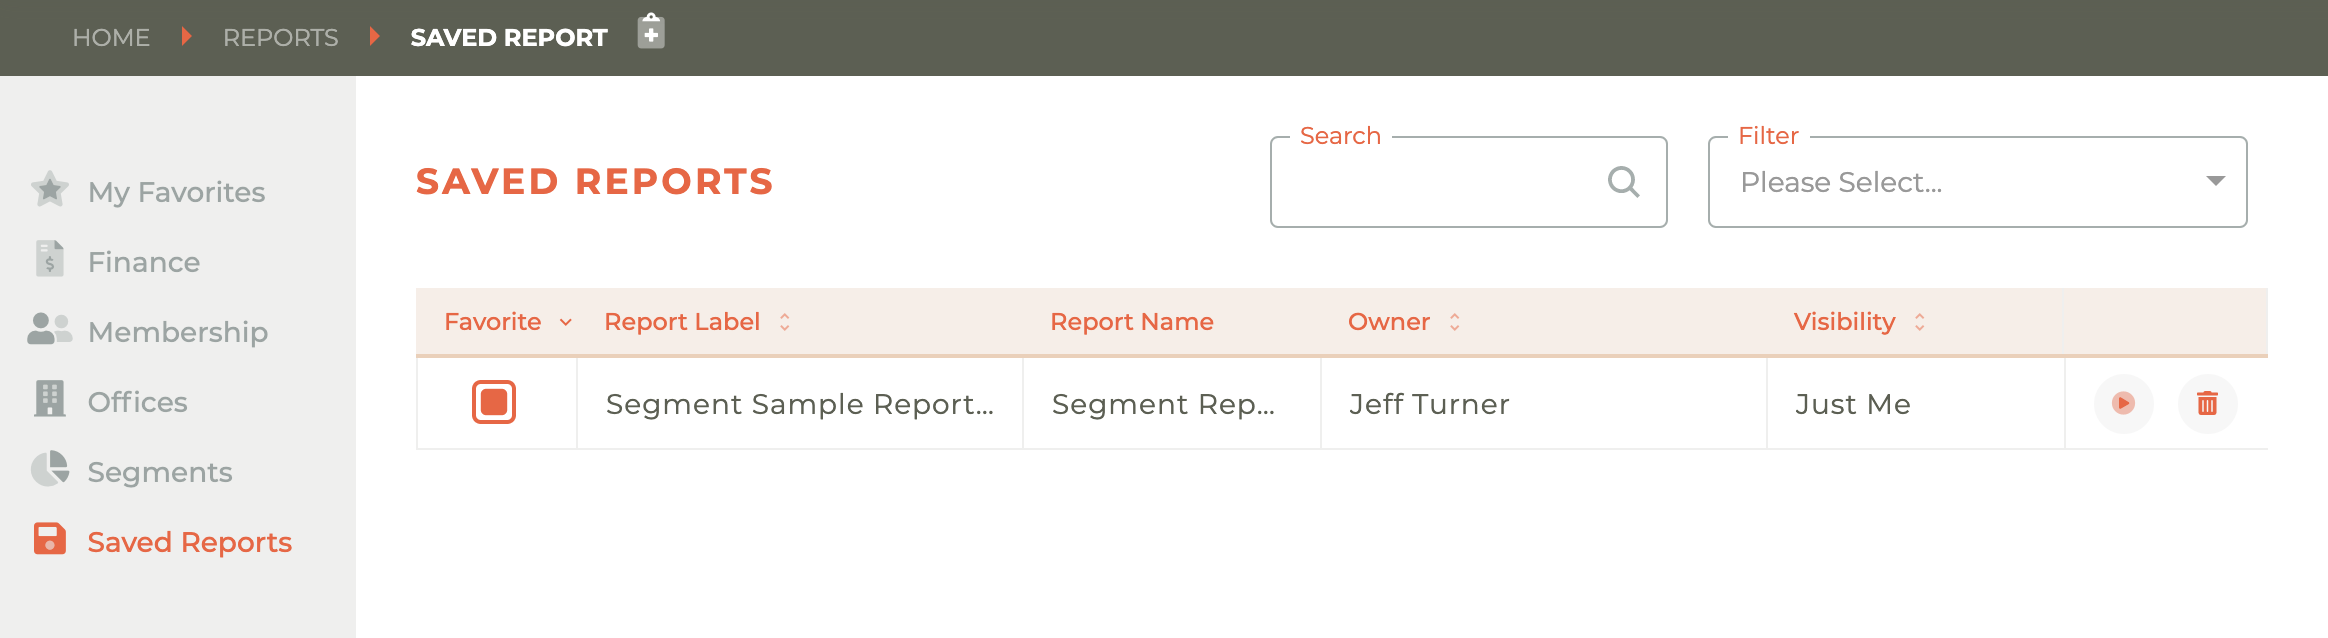
They can be found in two places. You may favorite any report that has been saved by navigating to the "Saved Reports" menu on the left hand side of the screen.
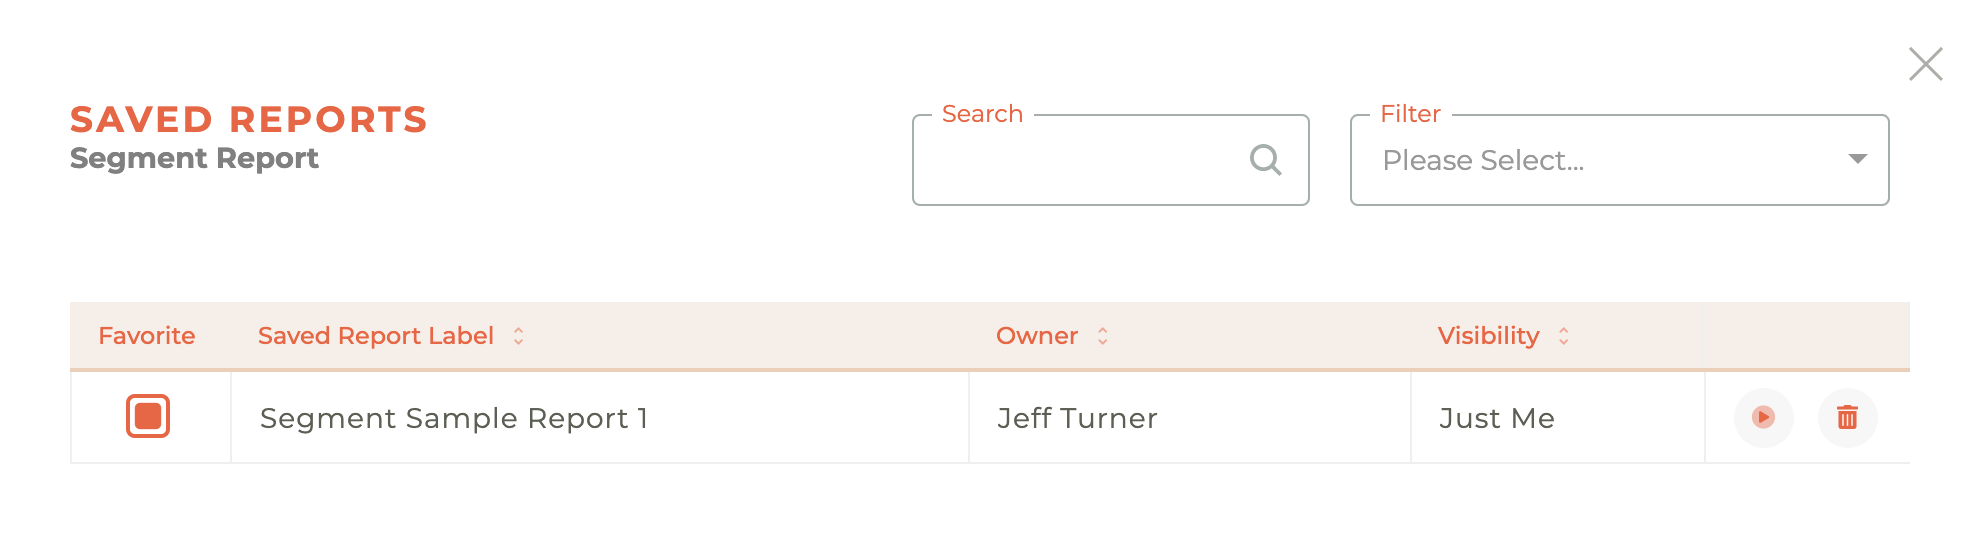
Or you can navigate to the "View Saved Reports" dashboard for any report generator. To do so, click on the - - check icon and a Saved Reports window specific to that report generator will slide out from the left side of the dashboard.
To learn how to save a report, click here: Saved Reports
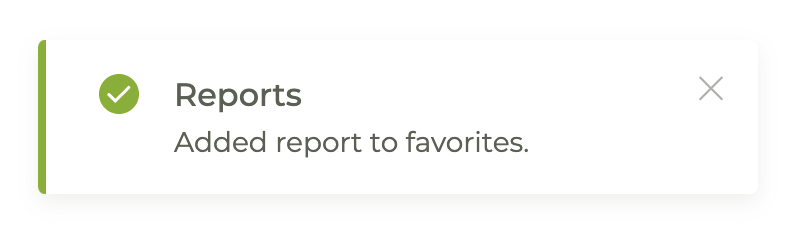
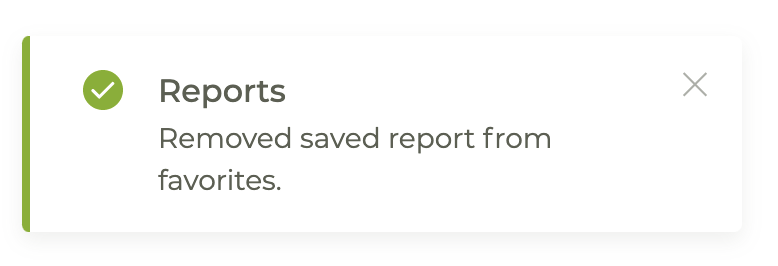
A modal window will appear at the bottom left of the screen to confirm when you have favorited or unfavorited any report.