¶ Report Categories
Report Categories in Tangilla are updated as new report categories are required and not all users will see every Report Category. Every Report Category contains one or more report filters or "report generators."
¶ Report Generation (Running A Report)
To generate a new report, click on the - - icon next to the report generator you'd like to edit. This will cause the "Run Report" window to slide out from the left side of the specific Report Category dashboard.
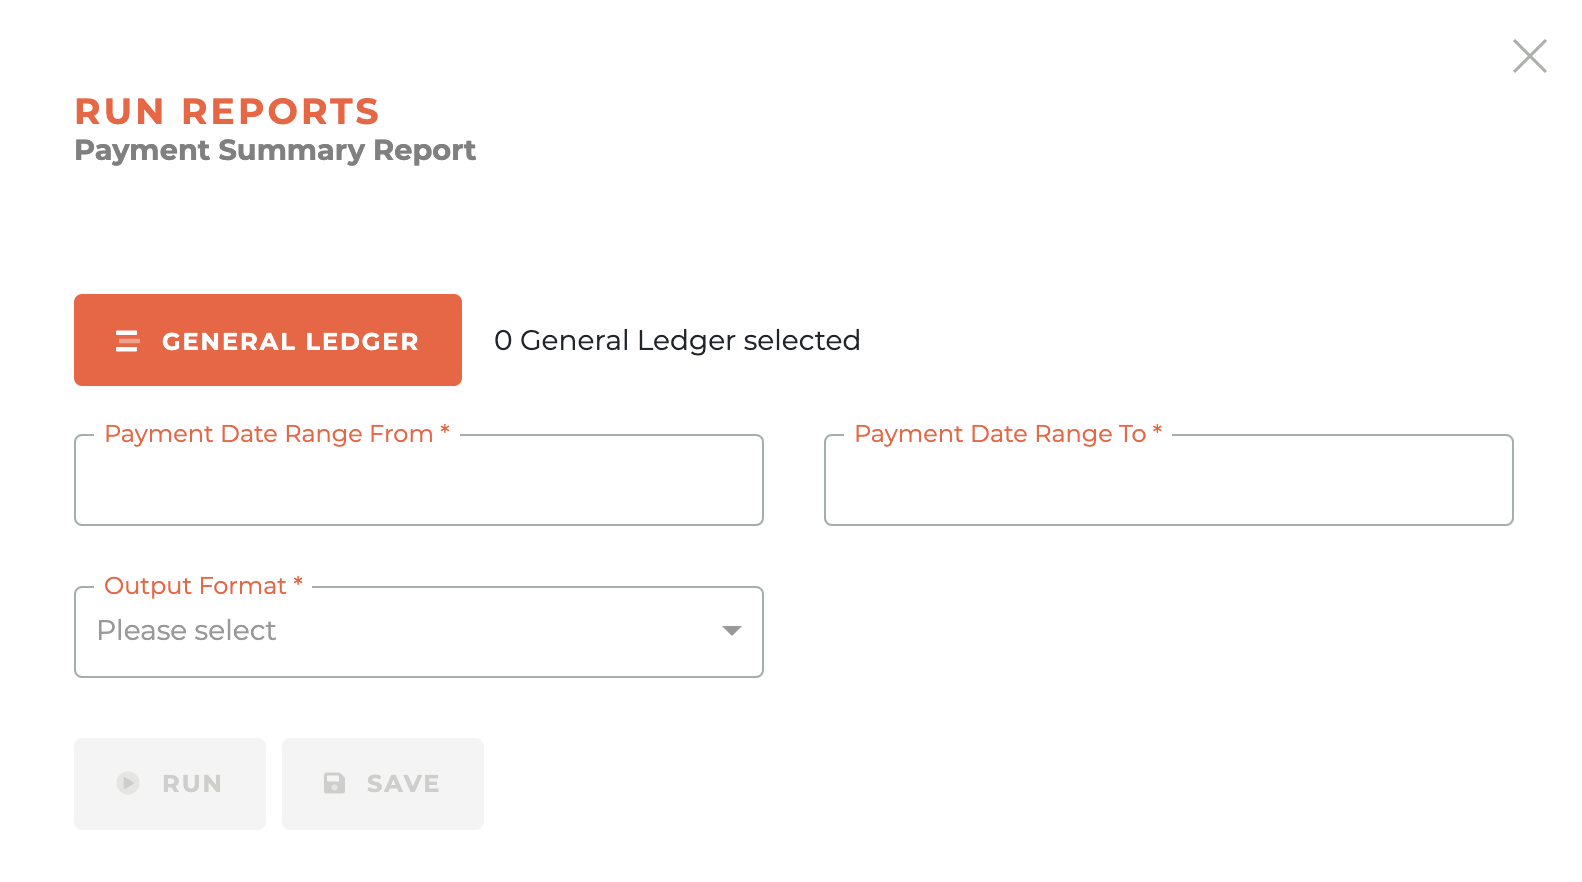
While some reports are single purpose reports and only allow Output Format selection, most Report Categories may contain multiple "report generators,? and each report generator has a custom set of selectable items that can be configured when present. Each of these operate in the same way. In the example below, clicking on the "General Ledger" button will reveal which general ledger or ledgers you wish to include in the report.
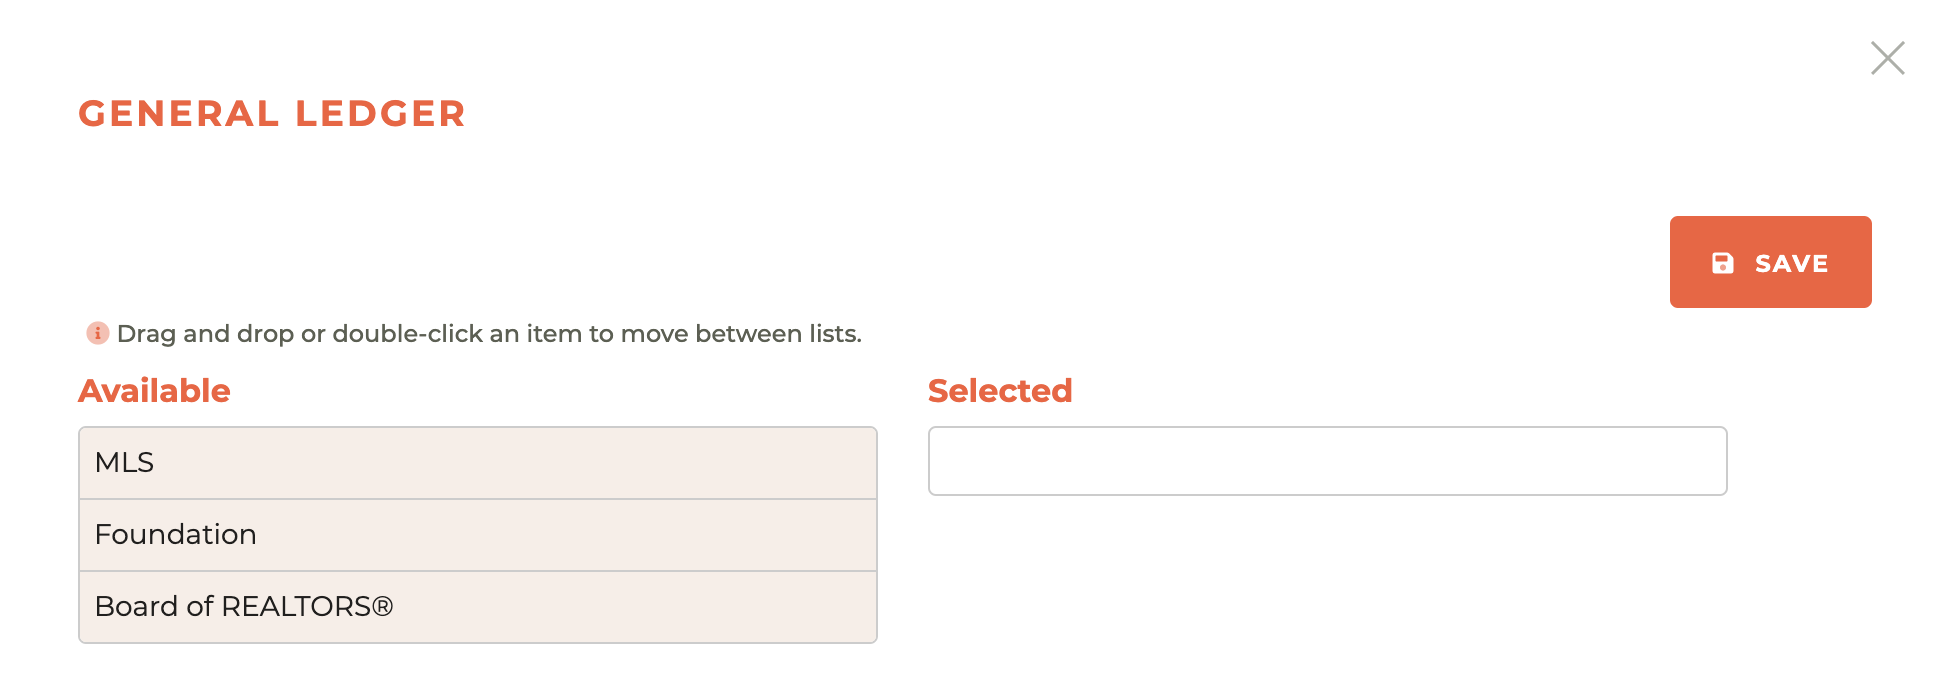
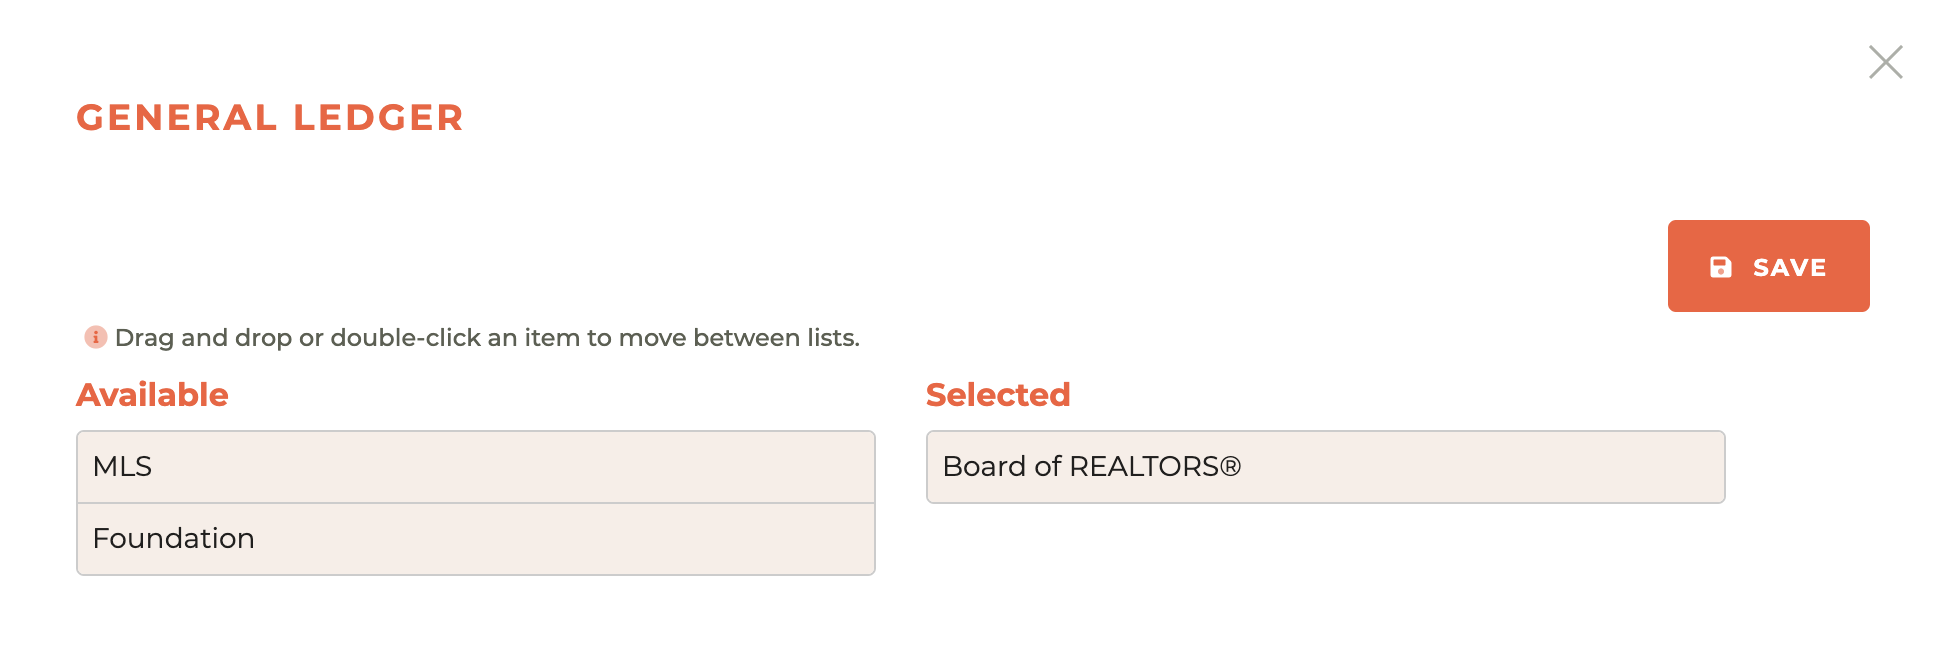
Double-click on any of the options in the "Available" column and they will transfer to the "Selected" column. You may also drag from the Available column to the Selected column. Once you've made all of your selections, hit save.
New options for filtering will appear as you progress through the report creation process and you will follow the same steps for each option. Once you have chosen all of your filters, date ranges and output formats (CSV or Screen), you can either run the report or save the report. If your output format is "CSV," your CSV will immediately download when you hit run.
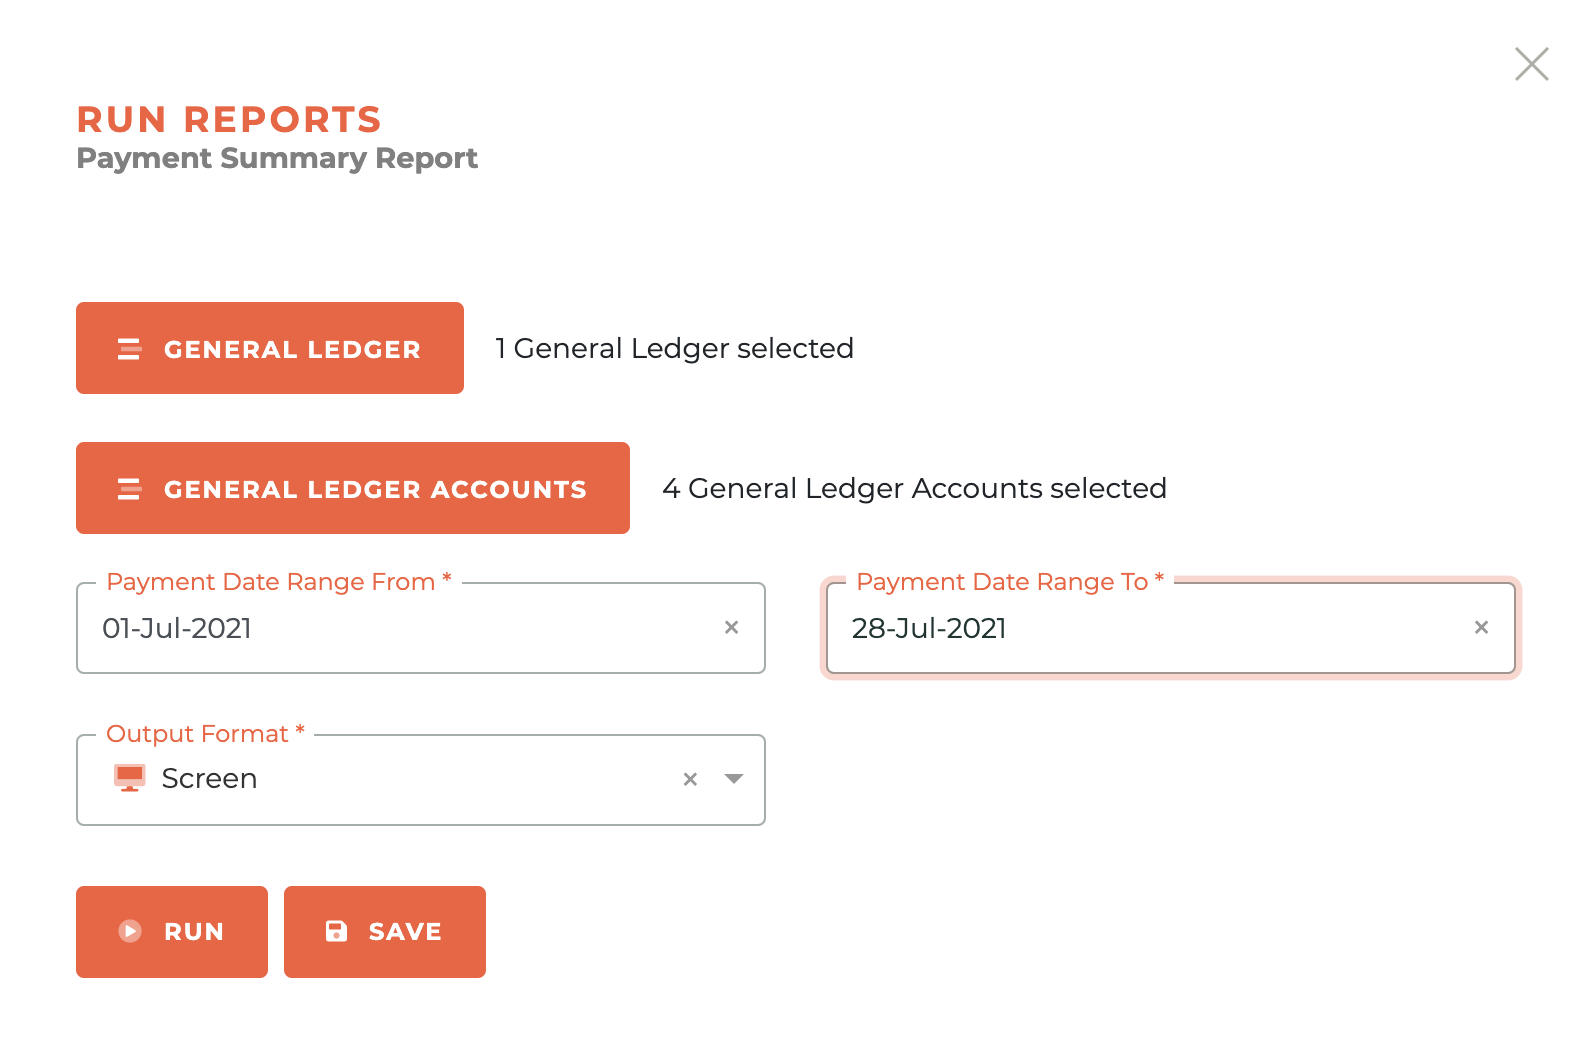
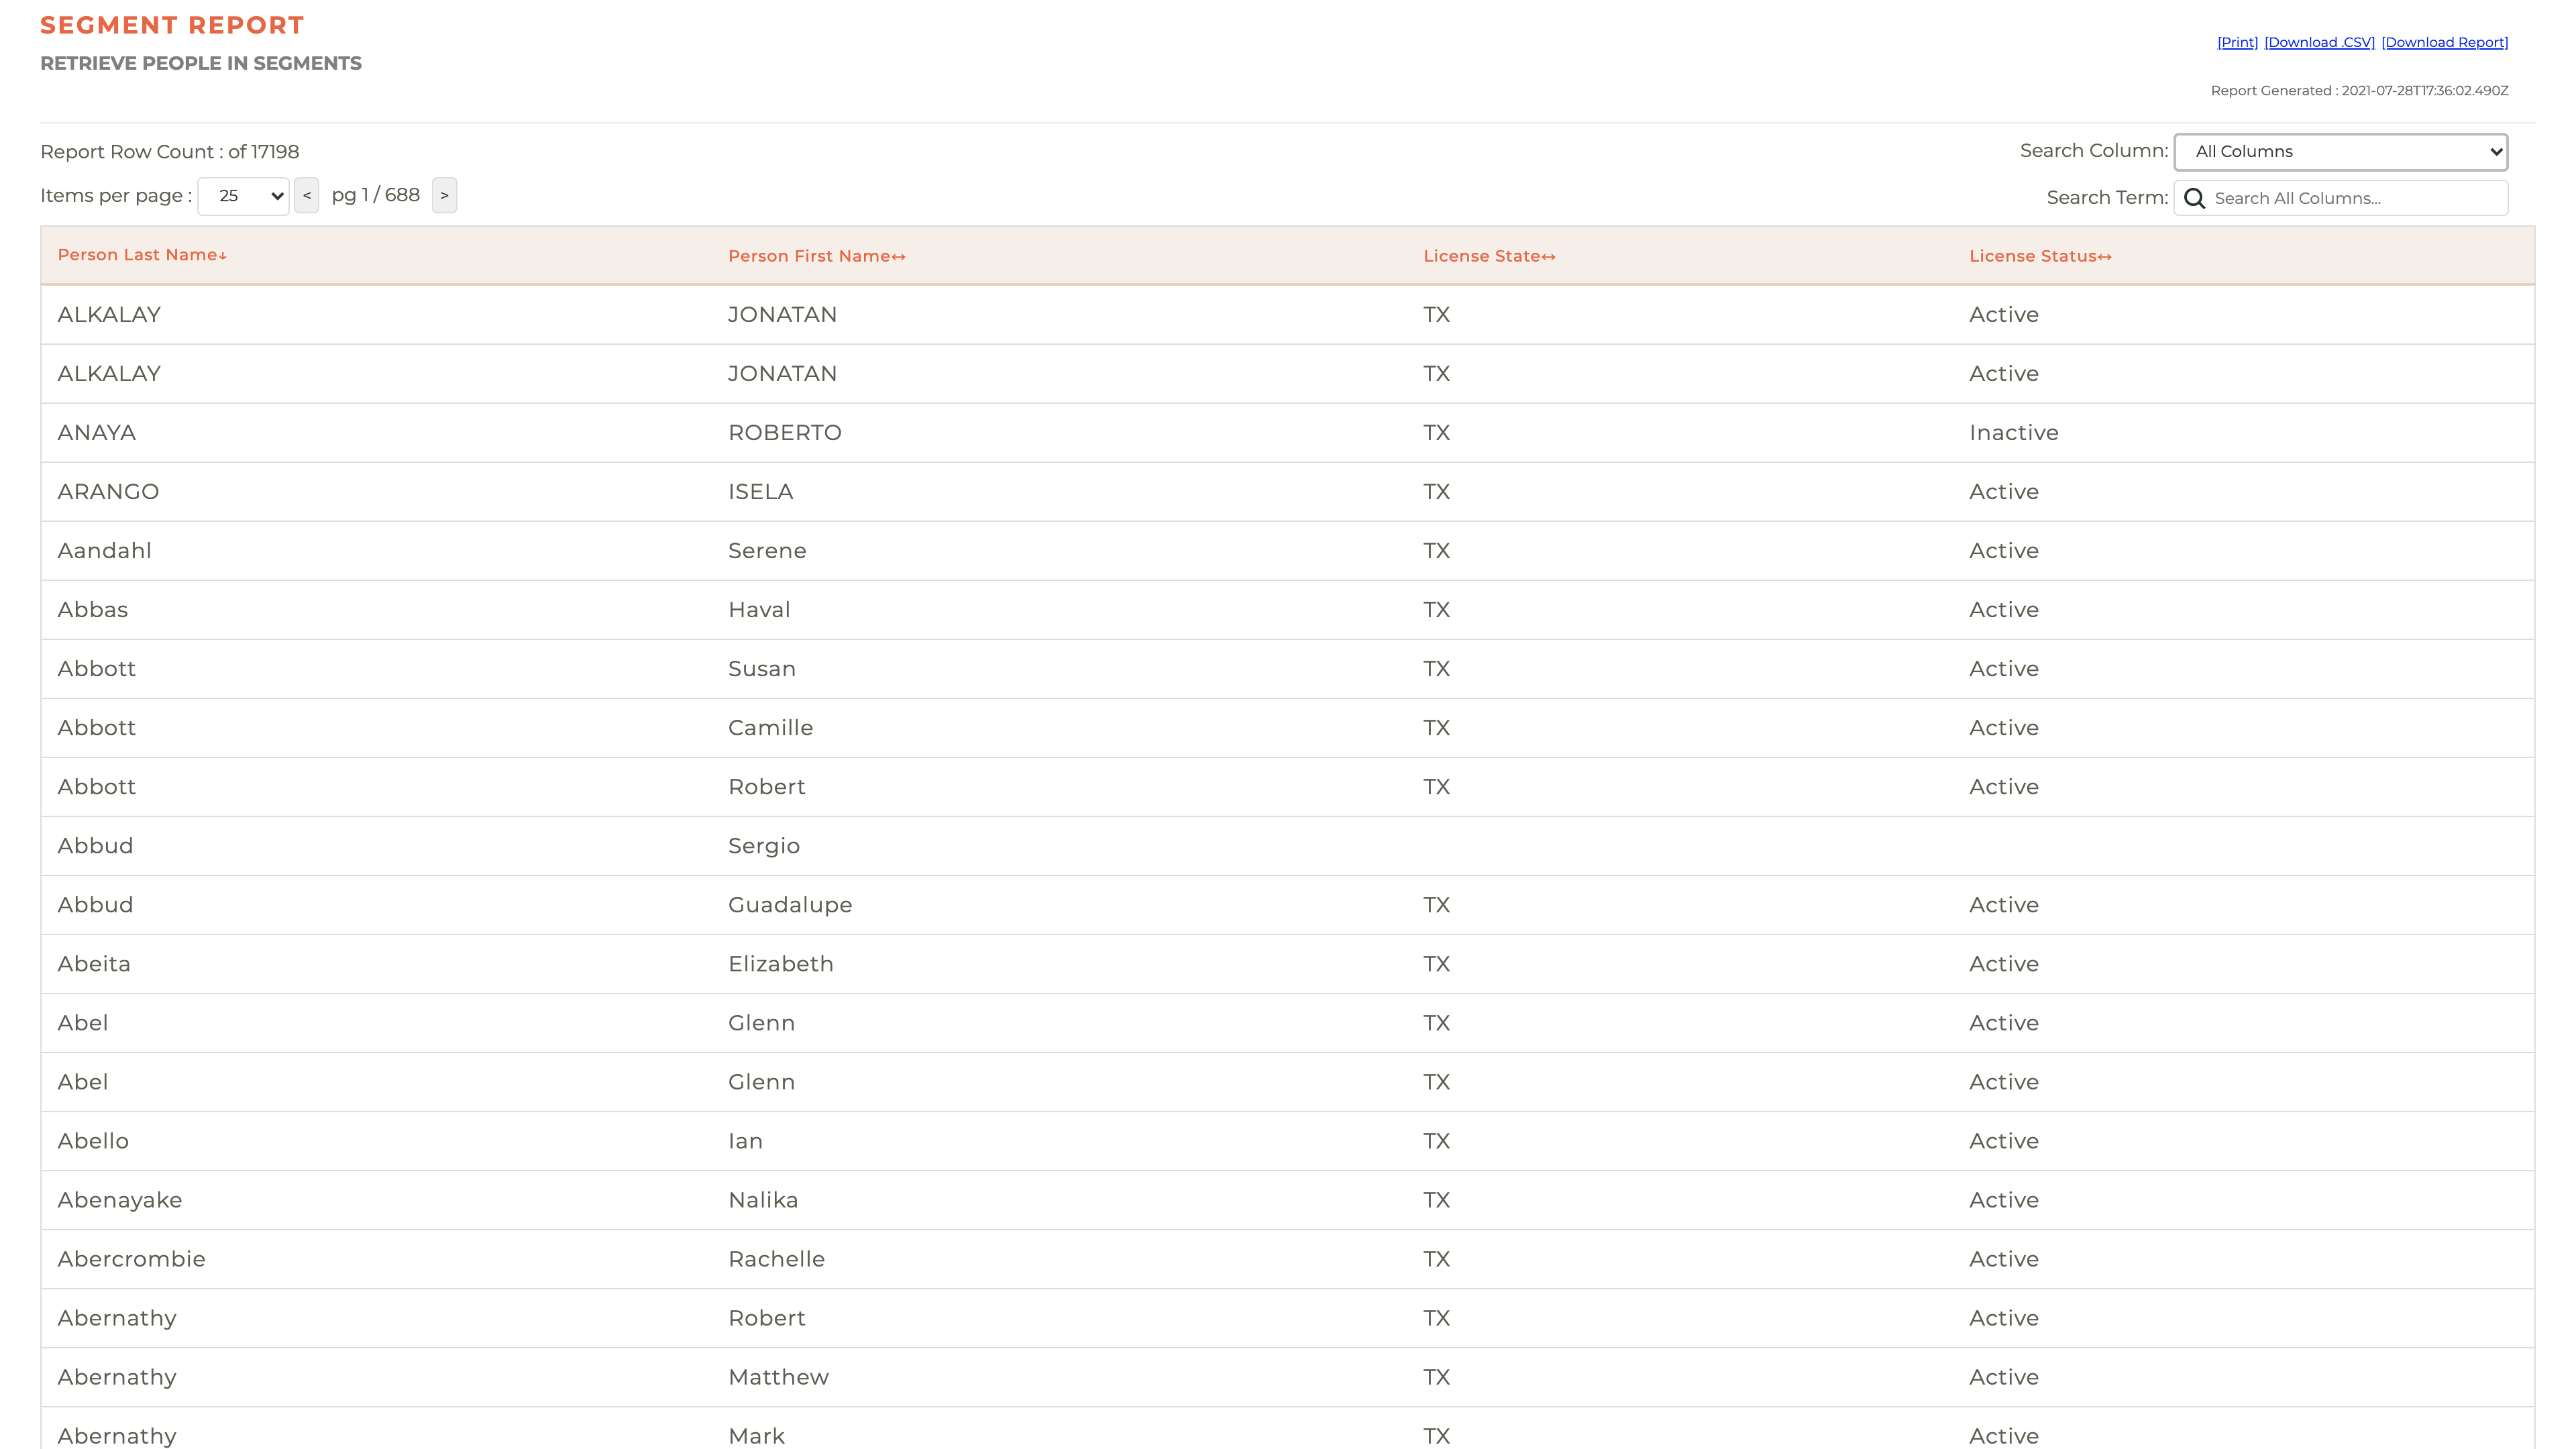
If your output format is "Screen," a window with the report will pop up and you will be able to navigate through the report, search and reorder columns immediately in your browser. You will also be able to print (to a printer or to PDF, download a CSV or download HTML. These options will be located at the top right of the page.

¶ HTML Reports
Downloading an HTML report is a great way to share a report. This allows you to forward the report.html file (you may, of course, rename the file if you wish) to anyone you would like to see the report and it will function with the same controls as the screen output. HTML reports are active reports and draw from live data. Here is a simple report example: simple_report.html
¶ Operations Reports
Operations reports are designed to monitor and evaluate the effectiveness and efficiency of the several operations elements and to assist you in making informed decisions based on the data presented in the reports.There are several report types that may appear based on the configuration of your Tangilla environment.
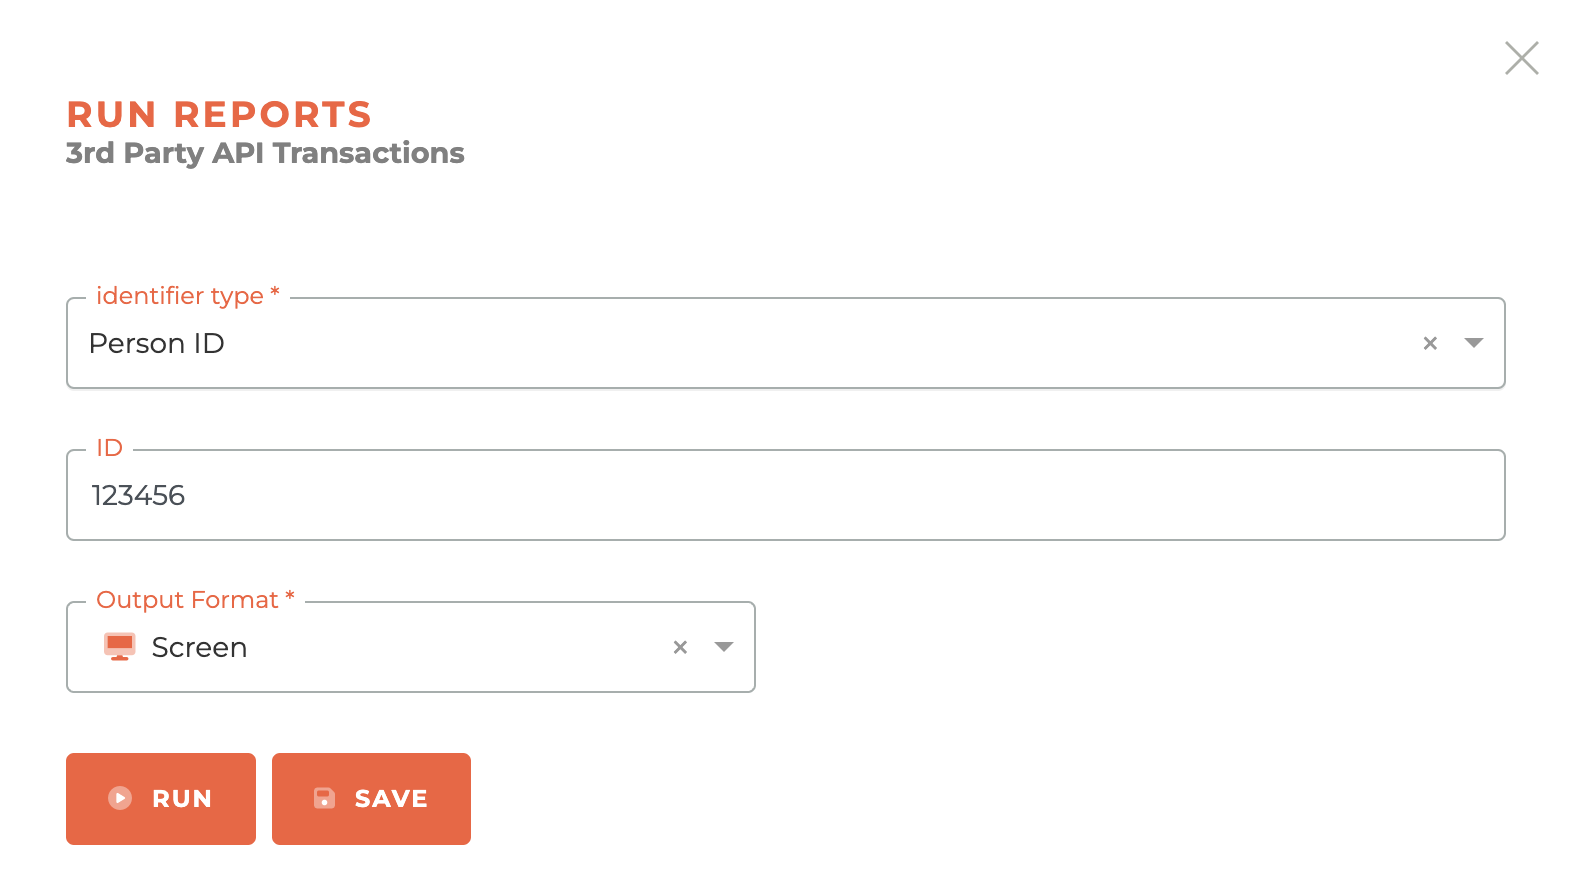
¶ 3rd Party API Transaction Report
The purpose of the third party API integration report is to provide an overview of the integration between Tangilla and specific entities, like your MLS, which may be integrated with out API. It will show specific API calls (messages) and their outcomes (response and response code).
¶ API Response Codes
RESTful API response codes are standardized HTTP status codes used to indicate the outcome of an API request. We show you these response codes in the 3rd Party API Transaction report for each call made to an API. These codes are divided into various categories based on the nature of the response. Here are some of the most common ones:
-
2xx Success - The server received, understood, and successfully processed your request.
-- 200 OK: Successful request and response. The standard, most common success code.
-- 201 Created: The request was successful, and a new resource was created on the server (e.g., a new user account was made after submitting a form).
-- 204 No Content: The server processed the request successfully but has nothing to send back in the response body (e.g., after you remove data in a field or change data in a field, the server confirms it's made the change without needing to load the details). -
3xx Redirection - The resource you requested has been moved. The server is giving your browser the new location.
-- 301 Moved Permanently: The resource has been moved to a new URL permanently.
-- 302 Found / 307 Temporary Redirect: The resource has moved, but only for a short time.
-- 304 Not Modified: Indicates that the resource has not been modified since the last request. -
4xx Client Error - The API has asked for something in a way the server can't understand or fulfill.
-- 400 Bad Request: The server cannot process the request due to a client error.
-- 401 Unauthorized: Authentication is required and has failed or has not been provided.
-- 403 Forbidden: The client does not have permission to access the requested resource.
-- 404 Not Found: The requested resource could not be found.
-- 405 Method Not Allowed: The request method is not supported for the requested resource. -
5xx Server Error - The server encountered an internal error or is temporarily unable to handle the request.
-- 500 Internal Server Error: A generic error message when the server encounters an unexpected condition.
-- 502 Bad Gateway: The server received an invalid response from the upstream server.
-- 503 Service Unavailable: The server is currently unavailable (overloaded or down).
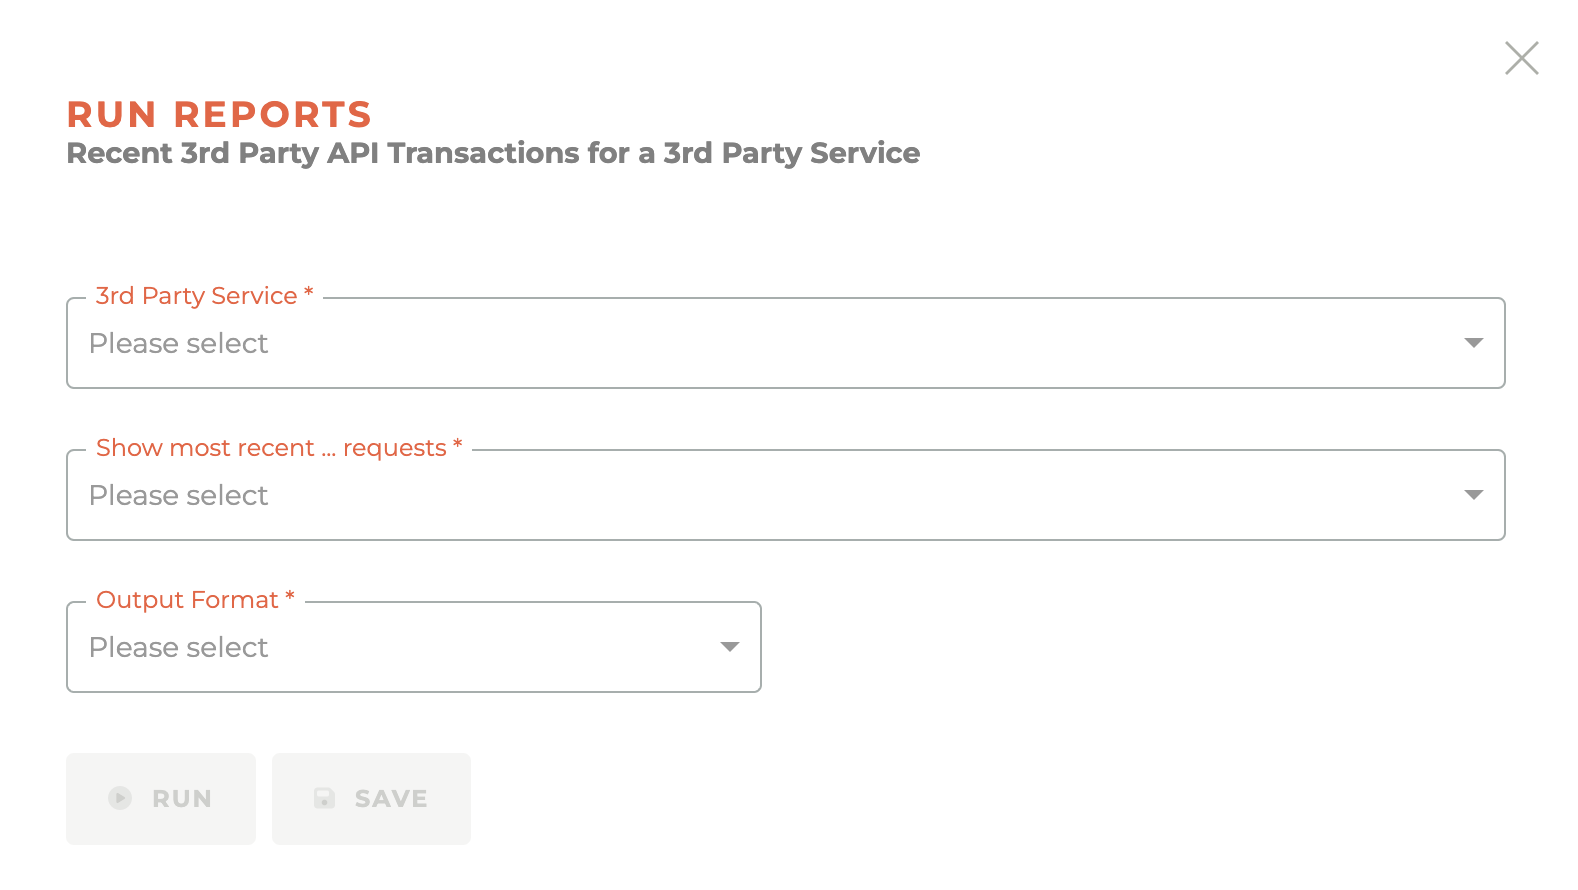
¶ Recent 3rd Party API Transactions for a 3rd Party Service
This report will show you the last 25, 50, 100 or 200 API transactions (calls) for any of the services available for you to see. The services available to you will be listed in the "3rd Pary Service" dropdown and may include M1, your MLS, your Lockbox service, and other integrations.
As with the 3rd Pary API Transaction Report that can be run on an individual or company, this will include the message we send, the response and the response code.
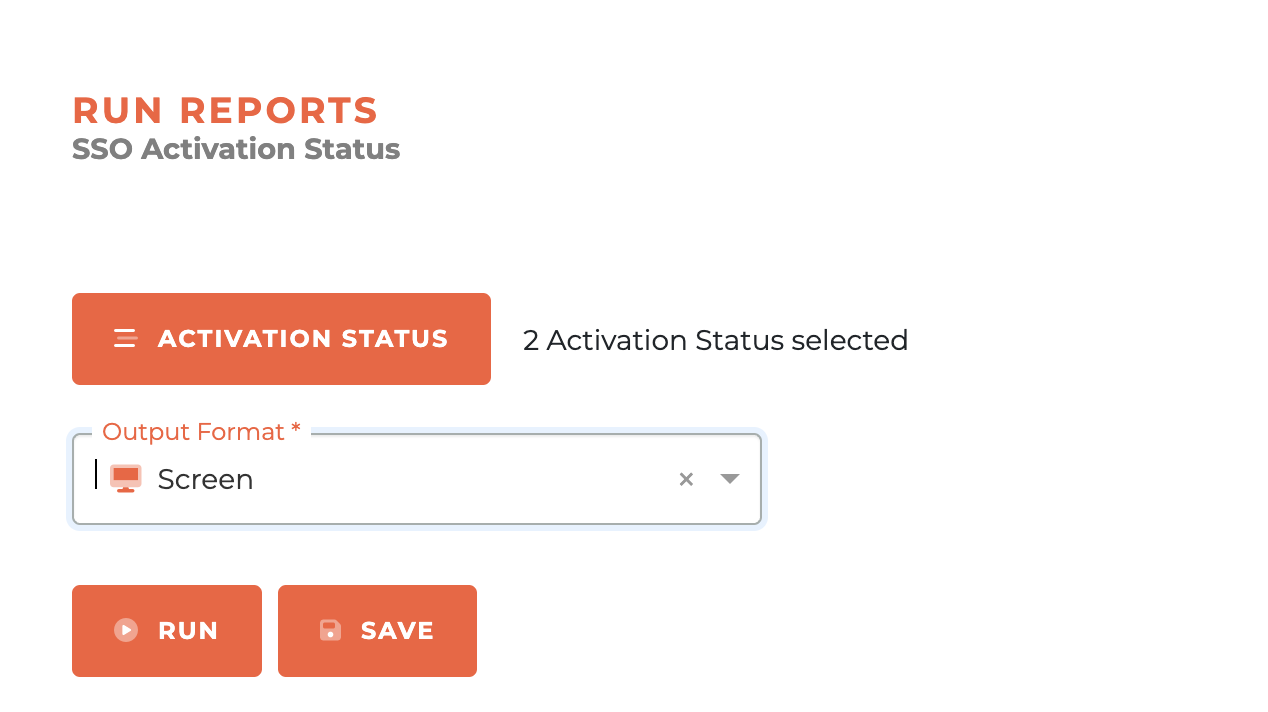
¶ SSO Activation Status Report
The SSO Activation report is available to Tangilla SSO clients for the 30 days after the launch of the SSO. The report logs for SSO activation are kept for 30 days, so you can track and encourage adoption. After 30 days, this report will no longer be valid.
¶ Report Categories List
- My Favorites
- Accounting (Available for third-party accounting firms or upon request)
- Committees
- Communications
- Data Feeds
- Education
- Events
- Finance
- Forms
- Members
- Offices
- Operations
- RPAC/Foundation
- Segments
- Subscriptions
- Texas (State Reports)
- Saved Reports
- Shared Feeds
- Reports Inbox
¶ Report Category Details
This list will be updated form time to time to reflecct the currently available reports. Some state reports are unique to the State product and will not appear for all users.
¶ My Favorites
- This section contains reports that a user has marked as favorites. It is the default menu when you land in Reports.
- You can remove a report from your favorites by navigating to the Report Category the where the report is located and unchecking the save box on the left hand side of the report.
¶ Accounting
These reports were requested by and designed for third-party accounting firms. Most of these reports are what we call "Requested Reports."
Requested Reports will run in the background and once completed will be available in the [Reports Inbox] section. The Requested Report will be sent via email as well.
- AR By Member - Shows each member’s outstanding accounts-receivable balance so you know exactly who owes what.
- AR By Revenue Product – Detail (Requested Report)
- AR By Revenue Product – Summary (Requested Report)
- Deferred Revenue by Class/Event/Tag (Requested Report)
- Invoices by Tag (Requested Report)
- Invoices Created – Detail (Requested Report)
- Invoices Created – Summary (Requested Report)
- Payments by Product – Detail (Requested Report)
- Payments by Product – Summary (Requested Report)
- Payments by Payment Types (Requested Report)
- Course Revenue (Requested Report)
- State/National Dues in Transit – Summary (Requested Report)
¶ Committees
- Committee Applications for a Period
- Committee Members (Position, Year)
- Committee Meeting Attendance
- Member Committee History
- Committee Information
¶ Communications
- Channel Opt-outs
- Email Performance
- People Suppression List
¶ Data Feeds
- Active Member Roster
- CasePro Data Feed
- Forewarn Data Feed
- Forewarn REALTORS Members Feed
- Noterouter Data Feed
- Open Invoices Data Feed
- Product Catalog Data Feed
- RESO MLS Member Roster
- RESO MLS Office Roster
- ShowingTime Office
- ShowingTime Roster
- Tether RE Data Feed
- Website Roster Feed
¶ Education
- Bundle Purchases
- Class No Show Report
- Outstanding Code of Ethics
- Outstanding Course Requirements
- Course Revenue
- RSVPs by Event/Class
¶ Events
- Closed Events
- Late Cancellations and No Shows by Class/Event
- Event Revenue
¶ Finance
- Ad-Hoc Invoice Aging
- Ad-Hoc AR by Income Account
- Ad-Hoc, Batch and Sponsorship Invoices for a Date Period
- Unpaid Bill Run Invoices
- Autopay Opt-ins
- Bill Run Auto Pay Invoices
- Bill Run Fees by Bill Type
- Draft Bill Run Invoices
- Bill Run Payments by Day
- Bill Run Receivables
- Suspended People for Non-payment of Bill Run Invoices
- Credit Request Report
¶ Forms
- Form Responses Report
¶ Members
- Member Counts
- Active Affiliate Roster
- Active Members with Unpaid Bill Run Invoices
- Duplicate Emails
- Get Designated Realtors
- Languages Spoken
- Inactive/Invalid Licenses
- Member Notes
- Get Primary Members by Orientation Date
- Membership Events, Classes and Contributions
- REALTORS where License Number in M1 Record Is Invalid
- Non-Member Licensee Payments for a Bill Year
- COE Suspended Members with Unpaid Bill Run Invoices
- Pending Amendments
- Incidents in Grace Period
- Secondary Membership Counts
- System Member Notes
- Unreported Licensees
¶ Offices
- Get New Offices from a Join Date
- Non-Member Salespeople Counts for Active Offices
- Office Roster with Subscription Status
- Offices with Corporate Structure Issues
- Corporate Structure Information from M1
- Corporate Structure Details
- Offices with Inactive DR
- Offices with Invalid DL
- Primary Offices with No Active Relationships
- Offices with RESO Office Type Issues
- Small Offices
- Top Offices
¶ Operations
-
3rd Party API Transactions - This is how to check to make certain that information is being sent to NRDS or M1, to the MLS (Perchwell, Paragon, Flex, Rapattoni, Matrix, etc), or to Supra or Sentriock properly. The report contains the requests we send and the response we get from the API for each service.
-
Unresolved Tangilla Support Tickets - This report lags a day behind, but gives you a snapshot of every open support case tied to your association. A header bar offers one-click actions to Print, Download .CSV, or Download Report, and displays the exact time the report was generated. Use the Search Column drop-down to limit your query to a specific field, then type a keyword in Search Term to filter the grid on the fly. The table itself lists each ticket’s Ticket Number, Contact, a direct Helpspot Link, current Status, Subject, the staff member Assigned To, and the Date Opened; clickable arrows on each header let you sort any column. A note above the grid shows how many rows are displayed, helping you track progress as tickets move toward resolution.
-
NRDS Errors (No longer supported)
-
Recent 3rd Party API Transactions for a 3rd Party Service - Shows the most recent (up to 200) API requests from a specific 3rd Party Service, like M1, your MLS provider, or your lockbox service.
-
SSO Terms Acceptance - for Tangilla SSO users who have enabled terms acceptance as part of the IDP configuration. It monitors who has accepted the terms and what options were chosen if options are available.
¶ RPAC/Foundation
- Campaign Finance Details (Local Only)
- Contributions Summary/Detail (Local Only)
- Last 5 Years Contribution History for a Segment (State Only)
- Aristotle Export (State Only)
- TREPAC Board Performance Report (State Only)
- TREPAC Investments with Missing Member Data (State Only)
- TREPAC Investor Detail Report (State Only)
- TREPAC Hall of Fame Watchlist (State Only)
- TREPAC Investment Summary by Board (State Only)
- TREPAC Summary Report (State Only)
- Unfulfilled Pledges (State Only)
¶ Segments
- Segment Report
¶ Subscriptions
- Association Subscriptions Summary/Detail
- Key Services Subscriptions
- Key Services Requiring Provisioning
- MLS Incompatible Subscriptions (Requested Report)
- Multiple Non-terminated MLS Subscriptions
- MLS User Class Overrides
- MLS Subscriptions Summary/Detail
- Subscription Report
¶ Texas Reports
- Abandoned Agents
- Active Members by Association
- Active Members With Invalid/Inactive/Expired Licenses Summary
- Active Unpaid Members – Detail (Requested Report)
- Active Unpaid Members Summary
- Posting Batch Subledger Detailed Report
- Emeritus Members
- LFRO Status
- Life Members
- TR Magazine Mailing List
- Members with Potential Orphaned Secondary Record
- Agents with Terminated Flag Set
- Unallocated Payment Items
- Under/Over Payment Items
¶ Saved Reports
- Any saved reports will appear here.
¶ Shared Feeds
- Any shared data feeds will appear here.
¶ Reports Inbox
- This is where your "Requested Reports" will appear. These are reports that take a long time to run and have the risk of timing out if they are run in the browser. These are run in the cloud and you are notified when complete.
¶ Frequently Asked Questions
| # | Question | Answer |
|---|---|---|
| 1 | What are Report Categories in Tangilla? | Report Categories in Tangilla group various report generators. These categories are updated as needed and may differ between users. |
| 2 | How do you generate a new report in Tangilla? | Click the play icon next to a report generator, select filters, dates, and output format (CSV or Screen), then run or save the report. |
| 3 | What is the difference between CSV and Screen output formats? | CSV downloads immediately when run; Screen displays the report in-browser with options to search, print, or download in various formats like CSV, PDF, or HTML. |
| 4 | How do you move items between the Available and Selected columns? | Double-click an item or drag it from the Available column to the Selected column. |
| 5 | What is an HTML report and how is it used? | An HTML report is a downloadable, shareable version that maintains live data and interactivity similar to the screen output. |
| 6 | What does the 3rd Party API Transaction Report show? | It shows messages sent to third-party services (e.g., MLS) along with their response and response codes to confirm integration success. |
| 7 | What are common API response codes shown in reports? | Codes include 200 (OK), 201 (Created), 400 (Bad Request), 401 (Unauthorized), 500 (Server Error), etc., categorized by status type. |
| 8 | What is the purpose of the SSO Activation Status Report? | To track SSO activation during the first 30 days post-launch, encouraging user adoption before logs expire. |
| 9 | Where do Requested Reports appear once they are generated? | Requested Reports appear in the Reports Inbox and are also sent via email. |
| 10 | How do users manage their list of favorite reports? | By marking/unmarking reports within their Report Category using the save box; the favorites appear under “My Favorites.” |
| 11 | What is the Reports Inbox used for? | The Reports Inbox stores long-running "Requested Reports" that are processed in the cloud to avoid browser timeouts. |
| 12 | Can HTML reports be renamed before sharing? | Yes, HTML reports can be renamed and shared while retaining their interactivity and live data access. |
| 13 | What types of reports are found in the Operations category? | Operations includes reports like 3rd Party API Transactions, SSO Activation, and Unresolved Support Tickets, designed to evaluate effectiveness and integrations. |
| 14 | Are all report categories available to every user? | No, report categories vary depending on user permissions and organizational setup. |
| 15 | What kind of filters can you apply when generating a report? | Filters vary by report but may include date ranges, ledgers, and product selections; all use the same drag-and-drop interface. |
| 16 | Is there a way for me to check to make sure that things are being sent to the MLS properly? | Yes, the 3rd Pary API report is designed to show you what data we have sent to the MLS and the response from the MLS API. This will allow you to see where any breakdown in communication may lie. |